Your cart is currently empty!
— by
In the last section, we looked at some basic things that the Enthought Traits package can do for you. In this section we’ll take a look at customizing the graphic interface, and build upon this familiarity to do some interactive graphing in the next.
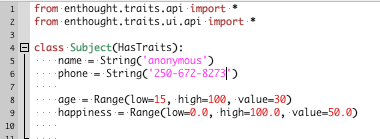
Last time we made a class of objects called Subjects, which has age and happiness as attributes. (Again, the color code is Class, instances, attributes, and methods.) Let’s warm up by adding traited name and phone attributes:

Note that on line 5/6 we asked for the name and phone to be a String object, as opposed to the native python type str. Python objects are case-sensitive, and many traited objects look like their native counterpart but with capitalized first letter – Int instead of int, Float instead of float and so on. Keeping everything else the same, running this program gives us this interface:

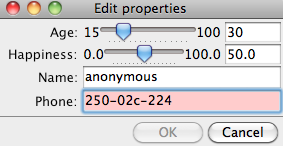
Note that String doesn’t seem to be very appropriate here, even though we wanted those – separators. People shouldn’t be able to enter U78-8902 as their phone numbers! This is where the variety of traited objects come in handy. Here, we could enforce the structure of phone numbers by the use of the traited RegEx object:

RegEx stands for regular expression, and these objects uses the second argument as a regular expression for what values are allowed. Regular expressions are fairly large a topic to tackle and I’ll leave that for you to explore. The line here, however, means that we’re only going to accept 3 digits (“\d”) followed by either a period or a dash, then 3 digits, another ./-, and 4 more digits. The interface will help prevent anyone from trying otherwise:

Notice how the field turns red, and the “OK” button is disabled. This is looking good – but all of the attributes are ordered alphabetically, and we really want the name to come first. It would also be nice to change the window’s name from “Edit Properties” to something else. How do we do that?
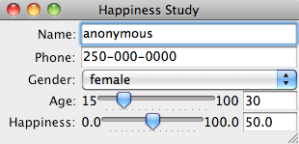
It turns out that the Subject .configure_traits() method first looks for a View object within Subject, and only do the default interface when there are no View objects to be found. So let’s add in a View object called Subject.traits_view:

Here I have also added a gender attribute, of Enum type, which allows us to choose from a set of values contained in a list (or tuple). This gives us an output that looks like this:

Our traits_view object contains several instances of Item, which themselves reference values from the (self.)name/phone/… attributes. (Would this be considered an example of delegation?) These Item()s are then displayed in that sequence.
Note that View objects contain attributes that specify “something” – e.g., whether the window is resizable or what its title should be. In fact, this is general of traited objects, and you can query what is available to that object by looking up the API reference on code.enthought.com (as an example, the one for View is here).
Sometimes you may wish to have more than one view for an object – for example, we may want a publicly available interface for bob that doesn’t contain his phone number. We can do that by defining multiple views and specifying which one to use:

If no view is specified (for example, when bob.configure_traits() is called), the instance of View named traits_view take precedence over others.
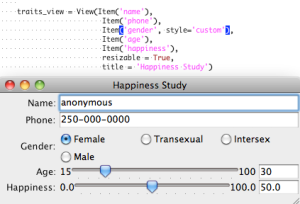
Before we close this section, I’d like to point out that when you supply gender (an Enum) to a View(), the View object is actually constructing a “default editor” for how to display the item. This look can be customized (see figure below), and more instructions on that can be found at the Editor Factory page.

And this concludes the second part, where you’ve learned to define and customize multiple interfaces for objects containing multiple traited types. That’s alot of ground already! In the next section, we’ll consider the case where we didn’t measure (age:happiness) for bob on a single date, but instead did a longitudinal study where we look at how his happiness and wealth changes over the years, and do some interactive graphing of his “happiness time series”…
Leave a Reply